
Europe’s Far Right: Testing the Demographic Argument
Economic pressures, religious identity and historical memory shape Europe’s far-right politics. A UK case study examines what demographic and electoral evidence establishes about population change and future political power.
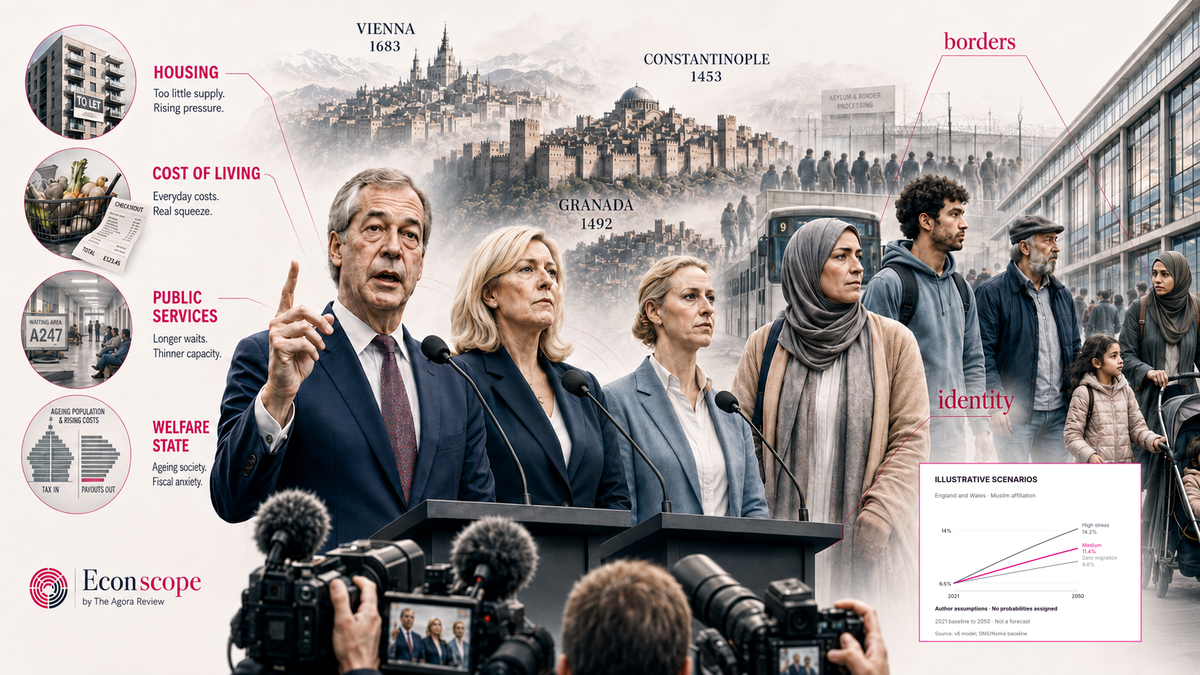
Economic pressures, historical memory and a UK case study of religion, population change and voting.
Claims about Muslim population growth give demographic figures a central place in Europe’s far-right politics. Our UK case study examines how far the evidence supports those claims, bringing together census data, constituency voting patterns and conditional population projections. Religious affiliation is changing, but those changes alone cannot establish future political control. Understanding that gap requires examining the economic pressures, political choices and historical narratives through which population change acquires meaning.
Analysis · German election update: · Election-evening edition
Prologue
As education minister, Papandreou signed a provision opening an additional 0.5% intake in specified higher-education departments to eligible school-leavers who were Greek citizens from Thrace’s Muslim minority. Research on their schooling documents how Greek-language difficulties and educational conditions obstructed access. The change gave citizens another route into higher education by adjusting the rules governing admission. Its subsequent effects on social integration were not measured in these sources. Law 2341/1995, Article 2; ministerial decision of 28 February 1996; Askouni, pp. 6–7.
Decisions about immigration extend this problem of access to people seeking entry, residence or citizenship, while affecting the communities in which they settle. Governments decide who may enter and set rules and budgets that shape the provision of homes, school places and other services. Parties compete over those decisions by explaining whose interests are being served and who bears responsibility when provision falls short. Population change enters that competition alongside voters’ economic circumstances, cultural commitments and judgments of government. Explaining the resulting support for a party means following how those concerns are interpreted and organised into political choices.
The accompanying research report develops the country comparisons, historical research and calculations behind this public account.
Saxony-Anhalt’s election brings the possible exercise of that authority into immediate view. On 6 September 2026, Reuters reported a historic first-place finish for AfD. The party’s state programme proposes restrictions on Islamic influence and public religious expression, including mosque architecture and the call to prayer, within what it describes as legally permissible limits. An electoral advance gives those proposals a different practical significance, although at the recorded evening cutoff the completed provisional result, seats and route to government remained unresolved. The dated counting record is retained in the methods below. Reuters, via Internazionale; AfD programme, pp. 65–66.
Similar anti-immigration and anti-Muslim themes appear in Greece around Ilias Kasidiaris, a convicted former leading figure in neo-Nazi Golden Dawn. In its 26 August report on his preparations for a political return, ΣΚΑΪ described his use of claims about the “replacement” of European populations by immigrants. Hostility towards Muslim religious expression also has a documented place in his record: in May 2013, AFP reported his threat to mobilise opposition to the construction of an Athens mosque. These appeals connect immigration and religious presence to an account of national threat. The August report established neither a release decision nor eligibility for a future election. ΣΚΑΪ’s dated report; AFP, May 2013; Kathimerini.
The two developments concern organisations with different histories and relationships to democracy. The PopuList’s scholarly classification defines the far-right family through nativism, which treats non-native people and influences as threats to a state conceived for its native group, and authoritarianism, which favours strict social order and severe punishment for challenges to authority. Within that family, the radical right challenges liberal-democratic constraints, while the extreme right rejects democracy itself. These distinctions keep an AfD, Reform or PVV comparison from collapsing into an equation with Golden Dawn. They classify parties; the people voting for a party can have different beliefs and reasons. The PopuList’s definitions and research; Mudde on the radical right and democracy.
The PVV and Reform also connect immigration and asylum to promises about national control. Such promises can address several concerns at once: the provision of services, confidence in government and the character of national life. Their appeal depends on how voters interpret those concerns and the people offering to act on them. A recent Kellogg Insight discussion of cultural-signalling theory examines one part of that process: how cultural messages can help voters judge a candidate’s wider commitments. The material pressures people face provide a concrete starting point for examining these political appeals. PVV; Reform.
01
How concerns become political support
A wealthy economy can leave households struggling to secure a home and build a stable life. Western Prosperity Reconsidered examines that gap through housing, ownership and access to opportunity. For people facing those difficulties, judgments about prosperity involve what their income and savings allow them to obtain.
England’s median home cost 7.6 times median annual full-time employee earnings in 2025, an improvement since 2021 that still left buyers needing substantial resources. The ratio compares a price with one employee’s earnings; deposits, other resources and mortgage terms shape what a household can afford. ONS affordability evidence.
A welfare cut makes a government decision felt directly in a household’s income. Someone affected may judge the government through that loss, while another voter may judge it through its approach to immigration, national identity or social values. Fetzer’s study links exposure to welfare cuts after 2010 with UKIP support, political dissatisfaction and the Brexit vote. It identifies a route by which a policy change could move some voters. Margalit’s review explains why that result leaves a broader question open: the people already supporting a populist party need not share the motive of those who have just joined it. Cultural discontent can also shape how people interpret their economic circumstances. Fetzer; Margalit.
Public services make those judgments concrete. A clinic with too few staff, an overcrowded school or a shortage of homes gives residents a problem they can identify and parties a failure they can explain. Population growth can increase demand; funding, staffing, planning and construction determine the capacity available to meet it. The Migration Observatory’s housing review follows these interacting conditions. A campaign that assigns the whole shortage to newcomers leaves decisions about that capacity outside its account of responsibility. UK housing review.
Promises to restore control give these disputes a political direction: they identify something government is said to have lost the ability to manage. Asylum accommodation, delays and contested removals make that claim concrete. The Public Accounts Committee examines the administrative system behind those outcomes; Reform’s programme presents them as problems its border and asylum proposals would address. The dispute over the Rwanda policy illustrates how the proposed remedy can reach beyond an individual service. In November 2023, the Supreme Court upheld the finding that the removal policy was unlawful because asylum seekers faced a real risk of return to persecution or ill-treatment. Reform’s 2024 contract subsequently proposed leaving the European Convention on Human Rights as part of its plan to stop Channel crossings. Reform’s proposal made the legal constraints on government part of its argument about border control. Public Accounts Committee; Reform's 2024 contract; Supreme Court, AAA and others.
Campaigns also convey information about the people seeking office. Acemoglu, Egorov and Sonin model politicians whose economic and cultural preferences are linked across candidate types, in a setting where voters can read cultural messages more accurately than economic ones. Under those conditions, cultural rhetoric can grow more divisive while economic messaging converges. A cultural message then helps a voter judge a candidate beyond the issue being discussed. This is a conditional theory of signalling, with assumptions that would need to hold before it could explain a particular European campaign; it supplies no ranking of European voters’ motives. Kellogg Insight, 1 September 2026; NBER Working Paper 34909, introduction and Figure 1.
The parties making these appeals operate in different electoral systems and political histories. Figure 1 records selected contests, giving the comparisons a dated point of reference. It includes parties with different relationships to government, so a bar’s height describes support in that contest rather than a common present-day measure of influence. Europe report and workbook.

Select the image to enlarge. Download PNG
Long description of figure 1
The horizontal bars show selected electoral snapshots for fifteen country rows, labelled by country and election year. Fourteen rows have a vote observation; Ireland is unavailable and has no numeric bar. France is highlighted. The display rounds France’s 31.37% to 31.4%, Hungary’s 54.13% to 54.1%, and Denmark’s calculated two-party total of 10.7591758% to 10.8%. Hungary concerns the Fidesz–KDNP national list in 2022. The adjacent table identifies the parties and full election dates; it and the workbook document the different denominators and source vintages.
Election dates, party identities and source table
| Country | Party or marker | Date | Election | Share |
|---|---|---|---|---|
| Hungary | Fidesz-KDNP | 3 Apr 2022 | National parliament, national list | 54.1% |
| France | National Rally | 9 Jun 2024 | European Parliament | 31.4% |
| Austria | FPÖ | 29 Sep 2024 | Nationalrat | 28.8% |
| Switzerland | SVP | 22 Oct 2023 | National Council | 27.9% |
| Italy | Brothers of Italy | 25 Sep 2022 | Chamber of Deputies | 26.0% |
| Netherlands | PVV | 22 Nov 2023 | House of Representatives | 23.5% |
| Germany | AfD | 23 Feb 2025 | Bundestag, second votes | 20.8% |
| Sweden | Sweden Democrats | 11 Sep 2022 | Riksdag | 20.5% |
| United Kingdom | Reform UK | 4 Jul 2024 | House of Commons | 14.3% |
| Belgium | Vlaams Belang | 9 Jun 2024 | Federal Chamber of Representatives | 13.8% |
| Spain | Vox | 23 Jul 2023 | Congress of Deputies | 12.4% |
| Norway | Progress Party | 13 Sep 2021 | Storting | 11.6% |
| Denmark | Danish People's Party + Denmark Democrats | 1 Nov 2022 | Folketing, Denmark totals; selected two-party sum | 10.8% |
| Poland | Confederation | 15 Oct 2023 | Sejm | 7.2% |
| Ireland | No comparable observation in the selected dataset | 2024 reference | Excluded from vote-based comparisons | Unavailable |
Denmark combines 93,428 Danish People’s Party votes and 286,796 Denmark Democrats votes out of 3,533,951 valid votes in Denmark (10.759%, rounded to 10.8%). Germany uses valid second votes; Hungary uses national-list votes; the UK uses votes cast across the United Kingdom; Belgium uses the federal national total rather than only Flanders. Other rows follow the valid-vote denominator of the identified contest; Switzerland uses its official party-strength measure. Population shares are separately dated in the workbook and are not contemporaneous with every election. Spain counts blank ballots as valid votes. Italy’s rounded 26.0% is the domestic Chamber snapshot in the Veneto regional council’s 20 October 2022 report, excluding Valle d’Aosta; the report identifies its Ministry returns as unofficial and partly incomplete.
Poland’s electoral observation concerns Confederation; the discussion of governing rhetoric also concerns PiS. Greece is discussed separately and is outside the workbook’s 15-country sample. Hungary’s Fidesz–KDNP observation is distinct from Mi Hazánk’s 5.88% in the same 2022 election. Hungary’s 2022 results.
France’s population figures also describe different populations. The INSEE/INED estimate of 10% in 2019–2020 covers people aged 18–59 living in ordinary households in metropolitan France; Pew’s 8.8% estimate for 2016 covers the whole population. Subtracting them would combine a change of coverage with a change of date. The workbook therefore leaves France’s demographic change unavailable. Denmark’s repeated estimate likewise supplies no measured change. INSEE/INED; Pew.
The selected-country calculations offer a limited way to examine the demographic part of the argument. Once incompatible change estimates for France and Denmark are left unavailable, and Ireland’s missing electoral observation is treated as missing, demographic change and electoral change correlate at approximately −0.096 across 12 countries with both measurements. Applying the archived quality screen yields +0.422 across seven countries; removing Norway then changes it to −0.073 across six. That final exclusion is an influence check, not a preferred sample. Both the sign and size depend on which observations remain.
The instability reflects a small, selected comparison whose religious definitions and electoral periods still differ after screening. It cannot show that demographics have no political effect or establish the primacy of another cause. Kaufmann’s 2017 LSE analysis illustrates how another specification can produce a stronger association: approximately 0.78 across 16 Western European countries, between projected Muslim share in 2030 and the highest election or polling support selected for the populist right. That compares an expected population level with a selected support measure, rather than recent changes in both. A direct replication is needed to explain the difference; the two correlations do not settle the causal question between them. Kaufmann's analysis.
The six-stage framework follows the decisions and interpretations that an aggregate comparison leaves unobserved. It begins with conditions such as migration and asylum flows, religious settlement, economic pressure and institutional performance. Geography, education, media use, trust and personal contact shape what people encounter. Parties, campaigners and media then select events and present accounts of security, cultural displacement, betrayal or decline. Voters interpret those accounts through their circumstances and commitments; political organisation mobilises them, electoral rules translate votes into seats, and bargaining can turn electoral support into policy influence. Integrated threat research; issue ownership; securitisation.

Select the image to enlarge. Download PNG
Long description of figure 2
The rows distinguish six questions and their illustrated components. Conditions include migration, asylum, settlement, population share, economic strain and institutional performance. Social filters include contact, homophily, education, geography, media and trust. Intermediaries include parties, media, religious and cultural organisations, social media and campaigns. Threat narratives concern control, identity, security, services, civilisational claims and betrayal. Voter interpretation covers perceived threat, blame, us-versus-them thinking, emotion, voting salience and social reinforcement. Possible outcomes include electoral gains, adoption of positions, policy change, agenda influence and political realignment. The sidebar contains shock and settlement; explicit anti-Islam entrepreneurship; secularism, security and identity; low presence and symbolic threat; mainstreaming; and the UK post-Brexit bridge. These are qualitative interpretations, with no measured causal ordering.
Six archetypes give the framework a comparative setting. They describe overlapping routes found in the country studies, rather than six fixed types of electorate.
Shock and settlement: Germany, Austria and Sweden. Refugee arrivals and local accommodation can make asylum administration and integration visible tests of government. People encounter the same national episode through different local settings, media and personal relationships. The country studies follow particular electoral and settlement outcomes within those settings, without assigning a common reaction to all three electorates. German electoral outcomes; Swedish refugee-camp exposure.
Anti-Islam entrepreneurship: the Netherlands. The PVV’s 2023 programme opposed Islamic schools, Qurans and mosques, joining restrictions on asylum to an explicit religious boundary. Such commitments make an issue part of a party’s recognisable identity. Petrocik’s concept of issue ownership describes how a party can build an appeal around an issue and oblige competitors to respond to it. PVV programme, p. 8; Petrocik on issue ownership.
Secularism and republican identity: France. Disputes over Islam meet an established vocabulary of laïcité, security and citizenship. The 2004 rules on conspicuous religious signs in public schools provide one institutional setting. Arguments about the reach of a school rule can extend into claims about membership of the national community, changing the people and conduct to which the proposed restriction would apply. French guidance on religious signs in schools.
Low presence, high symbolic threat: Hungary and Poland. Research on rhetoric in 2015–2017 records appeals to sovereignty and civilisation despite small settled Muslim populations. Hungary also experienced substantial asylum transit and applications in 2015. The combination distinguishes settled presence from exposure to a particular migration episode, while showing how national messages can carry beyond the places where people settle. Research on Hungarian and Polish rhetoric, 2015–2017.
Mainstreaming or absorption: Denmark, Italy and Switzerland. Restrictive proposals can gain influence when established competitors adopt them, when their proponents join a coalition or when they govern. Denmark’s Social Democrats illustrate adoption by an established party; Italy and Switzerland involve different arrangements of government participation and agenda influence. Following these routes reveals political changes that one challenger’s vote share cannot capture. McManus and Falkenbach on Denmark; the report's country comparisons.
Post-Brexit bridge: the United Kingdom. Reform connects immigration and asylum commitments with the performance of governments that promised greater control. Its programme identifies the offer; voter research examines the mixture of Brexit identity, social values and dissatisfaction attracted to it. Sovereignty and border administration become ways to judge whether a government can keep its promises. Reform; British Social Attitudes; coalition research.
Figure 3 places those examples around exposure and political framing. Its positions and distances are schematic and unmeasured; countries can overlap or change over time. The typology keeps the route to influence visible without treating the diagram as a numerical ranking.

Select the image to enlarge. Download PNG
Long description of figure 3
The quadrant places exposure and visibility on the horizontal axis and political-symbolic intensification on the vertical axis. The axes have conceptual low and high ends, without numerical scales. Hungary and Poland illustrate limited presence and symbolic threat; the United Kingdom illustrates post-Brexit political competition. France illustrates secularism, security and identity; the Netherlands and PVV illustrate explicit anti-Islam campaigning. Brackets group Austria, Germany and Sweden as arrival shocks and settlement, and Denmark, Italy and Switzerland as mainstreaming or adoption of the migration agenda. Rounded country labels, six fuchsia tags, eight circles, three squares and a civic-building callout distinguish the labelled cases and groups. Positions and distances are schematic and unmeasured. They are neither estimated country rankings nor evidence that a proposed mechanism operated; country examples can overlap and change across periods. Case studies and party documents cited in report chapter 3 provide the qualitative context.
Across these routes, parties connect judgments about government performance with accounts of whose interests the state should serve. A dispute about whether enough homes or services are available can therefore become a dispute about who should have access to them. When religious affiliation supplies the dividing line, that argument reaches beyond border policy to the place of a community in national life.
02
When religion becomes a political boundary
Appeals to a shared national community can bring different grievances together by identifying people who are portrayed as outsiders. A religious boundary extends that category to established residents and fellow citizens, including people who have never crossed a border. Immigration rules concern entry and residence, including the movement within Europe contested in the Brexit debate. Presenting Islam as culturally foreign instead raises questions about belonging for people whose lives are already part of the country. It gives a political appeal a wider reach than a proposal about future arrivals.
Group-threat theory describes hostility through perceived competition for resources, status and power. Integrated threat theory separates four channels through which another group may be regarded as threatening. The terminology identifies a perception to be explained: a “realistic threat”, for example, means perceived competition over material resources or security, rather than a finding that the alleged harm occurred. Blumer; Stephan, Díaz-Loving and Duran.
- Realistic threat concerns perceived competition over jobs, housing, welfare, resources or safety.
- Symbolic threat concerns perceived challenges to values, identity, norms and cultural continuity.
- Intergroup anxiety concerns unease about everyday interaction with members of another group.
- Negative stereotypes supply prior generalisations through which people interpret behaviour and events.
Religious practices provide visible material through which these channels can be connected. A mosque, headscarf, school or call to prayer can appear in a dispute over a specific rule and also in a campaign’s account of the nation. Doerr’s research on AfD imagery examines the connections made between gender, citizenship and Muslim or migrant identity. The scope changes when an image used to criticise one organisation or practice becomes a judgment about everyone sharing a religion. Responsibility for an offence, an institutional decision or a political programme rests with the people and organisations involved, rather than with an affiliation category. Doerr's study of AfD visual politics.
The way people encounter a religious community also matters. Homophily, the tendency to form ties with similar people, can keep information circulating within networks of shared experience. Personal contact creates another source of knowledge. Pettigrew and Tropp’s meta-analysis finds that intergroup contact generally reduces prejudice, with the circumstances and quality of contact shaping the relationship. A local population share measures neither friendship nor the quality of an encounter: neighbours can live close by without knowing one another. Homophily research; contact meta-analysis.
Studies of refugee exposure underline why the outcome must be specified. A German panel study for 2012–2018 found that the share of respondents reporting that they were very concerned about immigration rose less in districts receiving larger refugee inflows, although it rose in both the higher- and lower-inflow groups. Its estimated relationship with affinity for the study’s right-wing party group was statistically indistinguishable from zero. The result concerns a smaller rise in the proportion who were very concerned, without establishing a fall in the right-wing vote. German panel study, results and Table 1.
Rickardsson’s Swedish study examines votes near newly established refugee camps and finds a short-term increase in the Sweden Democrats’ share. The effects varied with distance and prior settlement. In districts hosting new camps, later estimates were smaller and statistically indistinguishable from zero, although that does not establish that the effects had disappeared. In neighbouring districts, the parliamentary-election estimates remained similar across the two elections. Read alongside the German study, it describes another setting and another outcome. Geographic exposure, personal contact, immigration attitudes and votes therefore cannot be substituted for one another in an account of how settlement becomes political. Rickardsson’s Swedish study, sections 6.1–6.3.
The British constituency pattern supplies a further, descriptive observation. In the 609 Great Britain seats where Reform stood in 2024, its vote share tended to be lower where more residents identified as Muslim. Figure 4 shows that negative association alongside three other affiliation categories. It compares places at one election; it does not follow individuals through contact with a Muslim neighbour or identify what changed their vote. Commons constituency census data; election data.

Select the image to enlarge. Download PNG
Long description of figure 4
Four horizontal bars extend to either side of zero. They compare Reform’s 2024 vote share with the shares of residents in four religious-affiliation categories across the 609 Great Britain constituencies it contested. The coefficients are Christian +0.447357, no religion +0.104126, other religion −0.240548 and Muslim −0.304498. The Muslim bar is highlighted in fuchsia. The correlation axis runs from −1 to +1. These geographical associations do not reveal individual voting motives; that requires evidence from voters themselves.
The four categories use the Commons app’s grouping. “Other religion” combines Sikh, Jewish, Buddhist and other affiliations while excluding Christian, Muslim and Hindu affiliation; Hindu affiliation is not plotted. It differs from the separate “Other religion” category in the nine-category census model. The two sides of the comparison also concern different populations: census shares describe residents, whereas vote shares describe votes cast. Age, citizenship and turnout influence how those populations correspond.
YouGov measures an attitude that the constituency comparison cannot reveal. Asked about Islam’s compatibility with British values, 53% of 2,130 adults surveyed in Great Britain selected incompatible, 25% compatible and 22% unsure. The survey ran on 16–17 July 2025 for the Ahmadiyya Muslim Association UK. Among respondents recalling a Reform vote in 2024, 93% selected incompatible, with 239 unweighted respondents and a weighted base of 230 in that subgroup. Its smaller base gives the estimate less precision than the full-sample result. These are stated views about a religion and broadly defined values; the question measures neither discriminatory conduct nor the reason for a vote. YouGov’s questionnaire and tables.
A party can make such an attitude central to its public identity through issue ownership, or present it as a matter of emergency and survival through securitisation. These frameworks explain how to examine a campaign’s joining of migration, crime, secularism and foreign policy within one account of threat. Doerr’s imagery provides specific objects for that examination. Historical symbols can extend the account across time. The conquests, territorial losses and resistance recorded in European and Mediterranean history offer episodes from which movements can select a past for present-day disputes. The medieval symbols used by the English Defence League and Knights Templar International, examined below, show how that selection takes visible form. Issue ownership; securitisation; campaign imagery; medieval symbolism.
03
History, blame and the national future
Conquest and changing political frontiers
At the start of the seventh century, the eastern Roman Empire still ruled much of the eastern and southern Mediterranean. Modern historians call it Byzantium. Constantinople, established as Constantine’s imperial capital in 330, was its New Rome. Its inhabitants called themselves Romans, while Greek became the predominant language of the state and church. Roman political and legal continuity, Greek language and cultural inheritance, and Christianity shaped its institutions. This was an empire of many peoples, whose rulers and educated elites maintained an active relationship with Greek and Roman literature and learning. Byzantium’s Roman and Greek inheritance.
Islam emerged in Arabia in the seventh century. Muhammad’s migration from Mecca to Medina in 622 helped establish the community from which a new political power developed. After his death in 632, Arab Muslim armies conquered Byzantine Syria and Egypt, and subsequent campaigns took the empire’s North African provinces. Byzantium lost wealthy cities, agricultural regions and Mediterranean connections that had sustained its power. Farther east, Arab armies conquered the Sasanian domains in Iraq and Iran, overthrowing a separate Persian empire. The southern Byzantine losses and the destruction of Sasanian rule were distinct parts of the early expansion. Islam’s origins; Byzantium’s southern provinces; The Sasanian Empire.
Under the Umayyad caliphs, whose capital was Damascus, expansion continued west through North Africa and east towards the Indus. In 711, Arab and Berber forces crossed into the Iberian Peninsula and defeated the Visigothic monarchy. Further campaigns brought most of the peninsula under Muslim rule within several years. The conquered territory became known as al-Andalus. The overthrow of Visigothic rule established a new governing order across much of Iberia; its later history followed changing dynasties, territories and relationships with neighbouring Christian kingdoms. The Umayyad realm; Disney on the conquest; The Spanish Umayyads.
Al-Andalus did not remain a single, unchanged extension of the eastern caliphate. After the Abbasids overthrew the Umayyads in the east in 750, Abd al-Rahman I established an independent Umayyad dynasty in Spain. Córdoba developed as a centre of government and learning, and its architecture drew on traditions carried from Syria as well as those encountered locally. Over the following centuries, the extent of Muslim rule changed and eventually contracted as Christian kingdoms conquered territory. By the thirteenth century, Granada was the remaining Muslim-ruled kingdom in Iberia. Islamic Spain; Nasrid Granada.

Select the image to enlarge. Download PNG
Long description of figure 5
The wide map extends from western Iberia to Multan. Solid fuchsia arrows schematically connect Mecca and Medina with early expansion toward Syria, Egypt, the Maghreb and Iberia, and toward Iraq and Iran with separate eastern branches toward Merv and Multan. Alexandria is the Egyptian waypoint. Baghdad is an open-square marker identifying the Abbasid capital founded in 762, separate from the early Iraq direction. A dashed gray arrow links Constantinople with Vienna for the later Ottoman siege frontier; labels date Constantinople's Ottoman capture to 1453 and Vienna's sieges to 1529 and 1683. Two ordinal chronology strips show c.610, 622, 632–661, 661–750, 711, 750, 762, 1453, 1529 and 1683. The first date is approximate, following the Met's dating of the early revelations to Muhammad. Arrows encode broad directions across different periods. Exact military routes, political boundaries and rates of religious conversion require separate historical evidence.
Military victory changed sovereignty sooner than it changed the religion of the people living under it. Conversion to Islam in the medieval Middle East took centuries, with a pace that historians still debate. Christian and Jewish communities continued under Muslim rulers, often with protection for communal and religious life alongside a subordinate legal status. Levy-Rubin traces restrictions on non-Muslims’ appearance and conduct; Cohen’s research shows Jewish commercial and social interaction within an unequal order. The conditions of coexistence depended on the rulers, regulations and enforcement in each setting. A conquest date therefore cannot also serve as the date when an entire population became Muslim. Carlson on conversion; Levy-Rubin; Cohen.
Byzantium survived its early losses and later recovered some eastern territories. A further turning point came at Manzikert in 1071, when the army of Emperor Romanos IV Diogenes was defeated by the Seljuk sultan Alp Arslan. The subsequent loss of Byzantine authority across Anatolia cannot be reduced to that battle alone. Theotokis emphasises aristocratic conflict and civil wars, into which Seljuk forces were drawn, as mechanisms of the collapse that followed. Military defeat and struggles within the empire together opened territory to new rulers. Theotokis on Manzikert and its aftermath; Byzantium’s changing frontiers.
The Crusades brought western Christian armies into these eastern conflicts. Crusaders captured Jerusalem in 1099 and established states along the eastern Mediterranean; Saladin retook Jerusalem in 1187. Religious commitments operated alongside struggles for land, wealth and dynastic advantage. In 1204, the Fourth Crusade attacked and sacked Christian Constantinople, creating a Latin empire and fragmenting Byzantine rule. Byzantine rulers regained the capital in 1261, but their restored empire was territorially diminished. Acre’s fall in 1291 ended the principal mainland Crusader foothold. The sequence includes wars between Christians as well as wars between Christian and Muslim powers. The Crusades and their changing objectives.
The Ottomans emerged as a separate power in Anatolia during the early fourteenth century. They conquered Byzantine territories in Anatolia and extended their rule into the Balkans before taking Constantinople. In 1453, Mehmed II’s army captured the city, ending the Byzantine imperial government there and making it the centre of an expanding Ottoman state. Further conquests brought the remaining independent Serbian lands, Athens, the Greek Despotate of the Morea and Bosnia under Ottoman rule. These campaigns stripped distinct Christian polities of their sovereignty and incorporated their territories into the Ottoman state. Ottoman expansion before 1600; Parry on Mehmed’s conquests.
At the Mediterranean’s western end, the direction of conquest had reversed. The fall of Granada in 1492 ended the last Muslim-ruled kingdom in Iberia, after centuries in which its frontiers and ruling dynasties had changed. The Ottoman state’s expansion in southeastern Europe and the end of Nasrid rule in Spain belonged to different theatres, with different rulers and populations. The end of Nasrid rule.
Ottoman campaigns then carried the frontier deeper into central Europe. After the Hungarian defeat at Mohács in 1526, Süleyman’s army entered Buda but withdrew. His 1529 campaign again took Buda and proceeded to Vienna, whose siege failed. Direct Ottoman occupation of Buda began in 1541, a distinction obscured when the earlier campaigns are treated as permanent annexation. In 1683, another Ottoman army besieged Vienna; Polish forces under Jan III Sobieski joined imperial and other Holy Roman Empire troops in relieving the city. Neither siege captured Vienna. Buda’s successive occupations; Vienna’s two sieges; The relief of Vienna in 1683.
Historical memory in contemporary politics
This history of conquest and changing sovereignty offers a substantial repertoire for political accounts of national loss and resistance. The English Defence League’s St George imagery, including an Essex Division banner, shows how a modern movement can select a medieval symbol. Godwin and Trischler examine that material alongside the modern Knights Templar International movement. The organisations and images are identifiable; they reveal choices about how to present a community and its adversaries. Doerr’s work on AfD visual politics examines a different repertoire of gender, citizenship and religious identity, allowing those choices to be compared without assuming a single European memory. Medieval symbolism; AfD visual politics.
Placing a contemporary dispute beside an episode of conquest can invite an audience to read religious difference as a renewed territorial threat. This temporal compression is an interpretation of the imagery, rather than a measured audience or electoral effect. Godwin and Trischler identify the modern material; establishing how people received it would require audience evidence. Different publics recognise different histories, and national attachment can carry value independently of economic insecurity. Present-day Muslim citizens and residents bear no inherited responsibility for the rulers depicted in those histories. Identified uses of medieval symbolism.
Historical association can also alter how responsibility is assigned. Scapegoating describes blame that exceeds the evidence of a group’s contribution to a problem, or holds an individual responsible merely through affiliation. Migration can have aggregate effects on demand and public provision that policy analysis can assess. Turning those effects into guilt shared by a religious population adds a claim the aggregate evidence does not supply. Cohen’s account of moral panic follows the role of elite and media messages in constructing a threatening group and making a response appear appropriate. report's theory and mechanism discussion; Cohen's analysis of moral panic.
The proposed response can then become much broader than the failure it began with. When one population is made to stand for difficulties across housing, services and public order, exclusion or removal can be presented as a remedy across all three. Historical imagery gives this proposed exclusion a language of loss and recovery. Attributing these problems to religious affiliation does not, by itself, explain which housing, funding or public-order decisions would address them. Cohen on the construction and response to a threatening group; the report's scapegoat mechanism.
Population change and claims to power
Claims of demographic “replacement” carry accounts of national loss into the future. They can combine Muslim population growth, younger cohorts, fertility, migration and secularisation into a prediction of displacement or political control. Those population processes can be examined, while claims about who counts as European introduce separate questions of ancestry, citizenship and identity. A conclusion about future authority also assumes how people will vote, organise, exercise legal rights and govern. Selecting a neighbourhood for its high Muslim share adds a further step, from one local distribution to the future of a whole country.
The British evidence allows the demographic part of that argument to be examined in detail. The census records reported religious affiliation among residents; scenarios calculate what follows from assumptions about future population change; election results show where votes for a particular party were cast. Together, these sources allow the scale of observed change, the consequences of demographic assumptions and the relationship between settlement and voting to be considered separately.
04
UK affiliation, scenarios and voting
How much is religious affiliation changing, and what evidence connects that change to future political power? The census and local-authority observations, and the custom scenarios, cover England and Wales. The constituency comparison covers Great Britain, while Pew’s separately published projections cover the United Kingdom. Religious affiliation identifies neither migration status nor ancestry: Muslims can be locally born citizens and Europeans. These data describe religious composition, rather than measuring the displacement of a population defined as “European”. The starting point is the change people themselves report in the census.
National religious change
Between 2011 and 2021, Christian affiliation in England and Wales fell from 59.3% to 46.2%, while the share reporting no religion rose from 25.1% to 37.2%. Muslim affiliation rose from 4.8% to 6.5%, with the population increasing from 2,706,066 to 3,868,133. These percentages use all usual residents. The 2011 figures follow the original census release, whose percentages can differ slightly from later retrospective summaries. ONS 2011 release; ONS Census 2021.
Because the census religion question is voluntary and records self-identification, these changes combine demographic events with the retention or change of affiliation. Births, deaths and migration alter the population; people may also answer the question differently over time. Two snapshots cannot separate those contributions. Reading all nine categories together therefore places the Muslim increase within a wider movement away from Christian identification and towards no religion and greater diversity.

Select the image to enlarge. Download PNG
Long description of figure 6
The chart includes nine census affiliation categories. Each pair places 2011 on the left and 2021 on the right. Christian affiliation falls from 59.3% to 46.2%, no religion rises from 25.1% to 37.2%, and Muslim affiliation rises from 4.8% to 6.5%. Hindu, Sikh, Jewish, Buddhist, other religion and not answered remain visible.
Local visibility
National change is experienced through uneven local settlement. Tower Hamlets recorded a Muslim population share of 39.9% in 2021. Of the 331 local authorities in England and Wales, 46 had shares of at least 10%, 16 at least 20% and six at least 30%. These are cumulative counts, so the six authorities in the highest group are included in both lower-threshold groups. The distribution explains how substantial local presence can coexist with a national minority share. ONS census evidence; Workbook 2 local-authority calculations.
For a service planner, that distribution identifies where further investigation is useful. An area-wide percentage describes residents across its neighbourhoods. Individual schools and workplaces draw different populations, so the area’s average cannot stand in for their composition. Service capacity also depends on staffing and provision as well as the number of residents. A religious population share does not identify an institution’s officeholders or establish what decisions they make. Those are separate facts about how local authority is exercised.

Select the image to enlarge. Download PNG
Long description of figure 7
Three vertical bars show cumulative Muslim-affiliation thresholds in 331 England and Wales local authorities: 46 at or above 10%, 16 at or above 20%, and six at or above 30%. The first bar is fuchsia. Higher-threshold authorities are included in lower-threshold counts. Each column describes a cumulative threshold.
Age structure and future growth
The younger age profile gives population change a forward dimension. Muslim residents had a median age of 27 in Census 2021, compared with 40 for all usual residents in England and Wales. More of a younger population’s family formation lies ahead, so age structure can sustain growth even as fertility changes. The size of that growth also depends on mortality, migration, intermarriage and affiliation. A path to 2050 has to specify how those processes develop. ONS religion-by-age evidence.
Conditional demographic scenarios
The custom model advances the 2021 age–sex cohorts to 2050 under three illustrative sets of assumptions. Muslim affiliation reaches approximately 9.6% with zero migration and fertility convergence, 11.4% with medium migration, and 14.2% in the high-migration stress case. Medium migration assumes 300,000 net migrants each year, including 60,000 Muslims; the stress case assumes 600,000, including 150,000 Muslims. All three use fertility convergence and omit adult religious switching. The author chooses these migration and behavioural inputs; they are neither official forecasts nor scenarios with estimated probabilities.
The diagnostic and sensitivity results show how much depends on those choices. A 2011–2021 run with zero migration and fixed fertility ends 19.9% below the observed Muslim population and 29.5% below the population reporting no religion. Its omissions of migration and observed switching prevent it from validating the complete scenarios. Starting instead from the medium case, the reference and 12 one-assumption variants produce 2050 Muslim shares of 10.8–12.1%, across changes to fertility, migration totals, migrant composition, mortality, retention and switching. That spread covers the 13 reported computations, with no confidence-interval interpretation; joint changes can fall outside it. Assumptions, counts and every category’s diagnostic errors are in the report and methods note.
An official aggregate benchmark reveals another limitation. The custom medium path reaches 61.91 million people in England and Wales in 2049, against 65.03 million in ONS’s 2024-based projection, about 4.8% lower. The custom model still starts in 2021 and has not incorporated population change observed since then; its fertility and mortality assumptions are uncalibrated. Agreement with an aggregate benchmark would not validate religious composition, and this discrepancy shows why even the total needs to be treated cautiously. ONS 2024-based projections, Table 1.

Select the image to enlarge. Download PNG
Long description of figure 8
Three annual scenario lines start from 6.49% Muslim affiliation in England and Wales in 2021. By 2050 they reach 9.6% under zero migration with convergence, 11.4% under medium migration and 14.2% under the high-migration stress. The medium case uses fuchsia, with the others in gray. There is no shaded confidence band. Assumptions and historical diagnostic limitations apply to every line.
Pew’s independently published exercise, released in 2017 from a 2016 UK baseline, also projects a growing Muslim share under its selected migration assumptions. It reports Muslim shares in 2050 of 9.7% with zero migration, 16.7% with medium migration and 17.2% with high migration. Its medium case continues regular migration; its high case additionally extends the exceptional refugee-flow pattern from 2014 to mid-2016. Its numerical results differ from the England-and-Wales model because the geography, baseline, assumptions and methods differ. The shared direction of growth is a point of comparison, not independent validation of the custom calculations. These are historical conditional projections without probabilities, not a refreshed forecast for 2026. Pew report, country scenario table; Pew Appendix A: methodology.
None of the selected paths in either exercise produces a Muslim majority in 2050. That finding concerns these assumptions and this horizon; neither model examines political control or evidence of a coordinated plan. The outputs can inform questions about future service planning, although the models do not calculate service needs. Equal citizenship and freedom of religion do not depend on a group remaining below a particular population share. To examine the electoral side of the argument, the relevant population changes: it consists of those eligible to vote and those who actually take part.
Reform’s geography
In 2024, Reform won 14.3% of the vote across the United Kingdom and five seats, whose Muslim population shares were relatively low. Across the 609 Great Britain constituencies it contested, the correlation between Muslim resident share and Reform vote share was −0.304498. The other plotted coefficients are +0.447357 for Christian share, +0.104126 for no religion and −0.240548 for the Commons “Other religion” grouping. Together they describe where the party’s support was concentrated in relation to resident affiliation. Commons election results; constituency religion data; candidate-level election data.
Select the image to enlarge. Download PNG
Long description of figure 4, reprise
Four horizontal bars extend to either side of zero. They compare Reform’s 2024 vote share with the shares of residents in four religious-affiliation categories across the 609 Great Britain constituencies it contested. The coefficients are Christian +0.447357, no religion +0.104126, other religion −0.240548 and Muslim −0.304498. The Muslim bar is highlighted in fuchsia. The correlation axis runs from −1 to +1. These geographical associations do not reveal individual voting motives; that requires evidence from voters themselves.
The negative Muslim-share association survives two changes of sample. Including all 632 Great Britain seats, with zero Reform votes in the 23 it did not contest, gives approximately −0.276. Restricting the contested seats to the 552 in England and Wales gives approximately −0.392. Its direction is consistent across those choices, but the mechanism remains unresolved. Muslim residents’ own votes, age and eligibility can alter the electorate’s composition; turnout, urbanisation and other settlement differences can also contribute. None of these cross-sections observes a voter before and after contact with a neighbour.
Voter surveys describe commitments that a constituency coefficient cannot recover. British Social Attitudes’ 2026 analysis finds distinctive authoritarian and socially conservative views among Reform supporters, with a stronger association on that scale than for several dissatisfaction measures it examines. Migration attitudes and Brexit identity also enter the account. The authors connect the Conservative–Reform shift with disenchantment about government performance and Leave voters’ disappointment over immigration, and examine dissatisfaction with subsequent Labour performance. More in Common finds Reform drawing support from both major parties. This combines judgments about governing credibility with ideological appeal, without making an economic motive common to every supporter. British Social Attitudes, tables 5 and 8–9; research on Reform’s support base.
The YouGov result about Islam adds another stated attitude, without identifying the cause of these votes. Across the British evidence, religious composition is changing and future shares depend on demographic assumptions, while the constituency map reveals a relationship whose causes remain unresolved. The values surveys add evidence about the commitments and judgments voters bring to political choices. Establishing future political control would require much more than projecting a population share. The practical questions return to the promises voters find credible and the problems those promises would address. YouGov survey tables; research on political imagery.
05
Public decisions and their consequences
Households unable to obtain a home, or residents facing inadequate services, have concrete grounds for questioning government performance. In the campaigns examined here, promises about immigration and national belonging offer an account of why provision falls short and who should come first. Assessing that account requires following the causes of the shortage and the likely effects of the proposed remedy. The housing-policy evidence shows why this matters even when the stated aim is simply to make homes easier to afford.
Buyers enter the same market with different savings, inherited assets and access to credit, while planning, infrastructure and construction determine the homes available. Help to Buy demonstrates the consequence of acting on one side of that relationship. Carozzi, Hilber and Yu compared new-build homes near the Greater London boundary and the English–Welsh border. They found higher prices without detectable additional construction on the London side of the first boundary, but increased building without a noticeable price effect on the English side of the second. The programme expanded borrowing capacity in both settings; the supply response changed what followed. A proposal to improve access needs to identify that response as well as the people receiving support. Housing-policy evidence.
Migration affects demand for accommodation and supplies workers to construction and public services. The Migration Advisory Committee emphasises geographical differences, supply constraints and uncertainty in estimating the housing effects. Those mechanisms concern where people settle, how households form and how provision responds. Established Muslim residents and recent arrivals need not have the same circumstances or contributions. The contribution of migration therefore needs to be examined through those conditions. An explanation that assigns the shortage to religious affiliation leaves the relevant differences between residents, workers and households unexplained. MAC evidence.
Papandreou’s admissions provision changed one such rule, opening additional places to eligible minority school-leavers. Historical narratives and disagreements over identity can shape how a measure like this is debated; its practical effect begins with the opportunities the rule makes available. Wider integration effects need their own evidence, just as better housing cannot be assumed to resolve disagreements about national identity or reduce votes for a party. Institutions can nevertheless be held to account for the opportunities and services within their authority: who can obtain an education or a home, at what cost, and whether provision meets the needs of the people it serves.
Evidence and methods
The report supplies the country comparisons, historical discussion, theories and evidence tables. Workbook 1 contains the selected-country comparison. Workbook 2 records the census, local-authority, age, scenario and election calculations, defining the population and categories used in each. Its scenario results are imported from the accompanying Python code. Changing an assumption in the workbook does not update those results: the code has to be run again. The report, both workbooks and the calculation supplement are included in the supporting documents below.
Election sources, European comparisons and conceptual figures
At the frozen editorial cutoff of 6 September 2026, 21:44:04 UTC, the official Saxony-Anhalt table was stamped 23:40 CEST and reported 2,584 of 2,660 polling districts. AfD held 44.3% and CDU 17.0% of the 1,255,195 valid second votes counted. Polls had closed at 18:00 local time. Reuters described a historic first-place finish; the checked official record did not yet establish a completed provisional result or seat allocation. First place consequently did not establish a governing majority or government formation. The time and figures are a preserved election-evening snapshot, not a subsequent update. Reuters, via Internazionale; official overview; official interim count; result-publication status; official election procedure.
The archived 15-country workbook reported Pearson correlations of approximately 0.067 between changes in Muslim population share and vote share, 0.134 between its archived asylum measure for 2015–2016 per 100,000 residents and vote-share change, and −0.130 between Muslim population share and a rhetoric score assigned by the analyst. Those calculations combined changes that were not comparable and classifications that were incomplete. The asylum figures were rounded per-capita extracts whose exact source query has not been reconstructed. Applying the archived quality screen to an eight-country subset gave approximately 0.485, 0.123 and 0.693 respectively. A further exclusion changed the demographic-change correlation to −0.283 across seven countries. The size and even the sign of the result therefore depended on which countries were included.
The revised workbook leaves demographic changes for France and Denmark unavailable and Ireland's election observation missing, corrects party names and voting figures, and presents the revised samples alongside the archive. The corrected comparison between demographic and electoral change gives r = -0.096 across 12 countries with both observations available. Applying the archived screening rules to the revised data gives r = +0.422 across 7 countries. The samples are small and selected, and rhetoric was not coded uniformly. These coefficients cannot identify what caused a political outcome or establish a ranking of causes that applies everywhere.
The six-stage framework and six-archetype typology organise proposed relationships. Their arrows do not carry estimated effects, and their country groupings are neither measured positions nor mutually exclusive categories. The accompanying sources establish different things: party programmes record declared positions, historical research identifies particular events and their later uses, and surveys record reported attitudes. To establish whether a message reached or persuaded people, research must also examine its audience.
How the demographic scenarios are calculated and checked
The v6 model for England and Wales begins with 2021 population groups defined by age and sex. It uses the same simplified mortality schedule for both sexes and all religious categories, assumed fertility for women aged 15–49, assumptions about the religious affiliation of children, and migration totals and age profiles specified for each scenario. The documentation explains the order of the annual calculations and the treatment of the oldest ages. For the parent category “Other religion”, the corrected allocation assigns 0.91 of births to “Other religion” and 0.09 to “No religion”. These are author-chosen assumptions; they repair an allocation that was overwritten in the archived calculation. Where changes of religious affiliation are enabled, the calculation uses the population present at the start of that step and the specified age bands. The allocation matrices must preserve the number of people being allocated. Missing or invalid assumptions cause the calculation to stop.
Arithmetic and population-conservation checks establish that the calculations are internally consistent. They do not establish forecast accuracy. The report presents the 2011–2021 historical diagnostic for every category, the population counts and shares under each scenario, and tests that change one assumption at a time. The ±20% changes in fertility, migration and mortality, and the ±5-percentage-point changes in religious retention, were chosen to test how results respond to altered inputs. No empirical probabilities have been assigned to those changes, so the resulting spread is not a calibrated uncertainty interval. The historical diagnostic omits migration and observed changes of religious affiliation and therefore cannot validate the complete scenarios. Pew's separate 2017 exercise covers the UK and starts from its own 2016 baseline. Pew’s published methodology.
Which constituencies are compared
The four correlations compare resident religious-affiliation shares with Reform's vote share in the 609 Great Britain constituencies where the party stood in the 2024 general election. The Commons app allocates Census 2021 religion data for England and Wales and Census 2022 data for Scotland to the boundaries used in that election. Constituency codes link its exported data to election results recorded for each candidate. Census shares describe residents; vote shares describe votes cast. Age, citizenship and turnout affect which residents enter the electorate and take part in the election. Commons census app; candidate-level data.
The Scottish census asks whether a person belongs to a religion or denomination, while England and Wales ask a general religion question. Both the wording and the date of observation differ across that border. Including all 632 Great Britain constituencies and assigning zero Reform votes to the 23 where the party did not stand gives a Muslim-share correlation of approximately −0.276. Both samples describe differences between constituencies. Explaining an individual's vote requires evidence about voters themselves. Commons methods note.
Housing policy, wealth and the supply response
Gary Stevenson proposes annual wealth taxation, changes to capital-income tax and inheritance reform to restrain wealth concentration. Kristian Niemietz instead emphasises easier building, investment and savings-based pensions intended to broaden asset ownership, and argues that wealth taxes carry administrative and behavioural costs. Redistribution changes who commands purchasing resources, while construction and investment can increase the assets available. The proposals therefore require attention to how demand, supply and ownership meet in the particular market, without assuming that either programme would reduce support for the far right. Stevenson's proposals; Niemietz's account.
The Help to Buy study compares new-build homes near two boundaries. More generous support raised prices without detectable additional construction on the London side of the Greater London boundary, while building increased without a noticeable price effect on the English side of the English–Welsh border. The Migration Advisory Committee’s wider housing discussion concerns migration, demand, supply constraints and geographical uncertainty. These sources support the stated housing mechanisms; they do not rank housing against cultural or political explanations of voting. Housing-policy evidence; MAC evidence.
You can find the supporting documents below: