
Will fewer people mean more homes to go around in Greece?
Fewer households against an unchanged stock of homes would ease housing pressure. Greece's population decline can produce that result, but smaller households can absorb it. The scenarios show when demand falls relative to available homes.
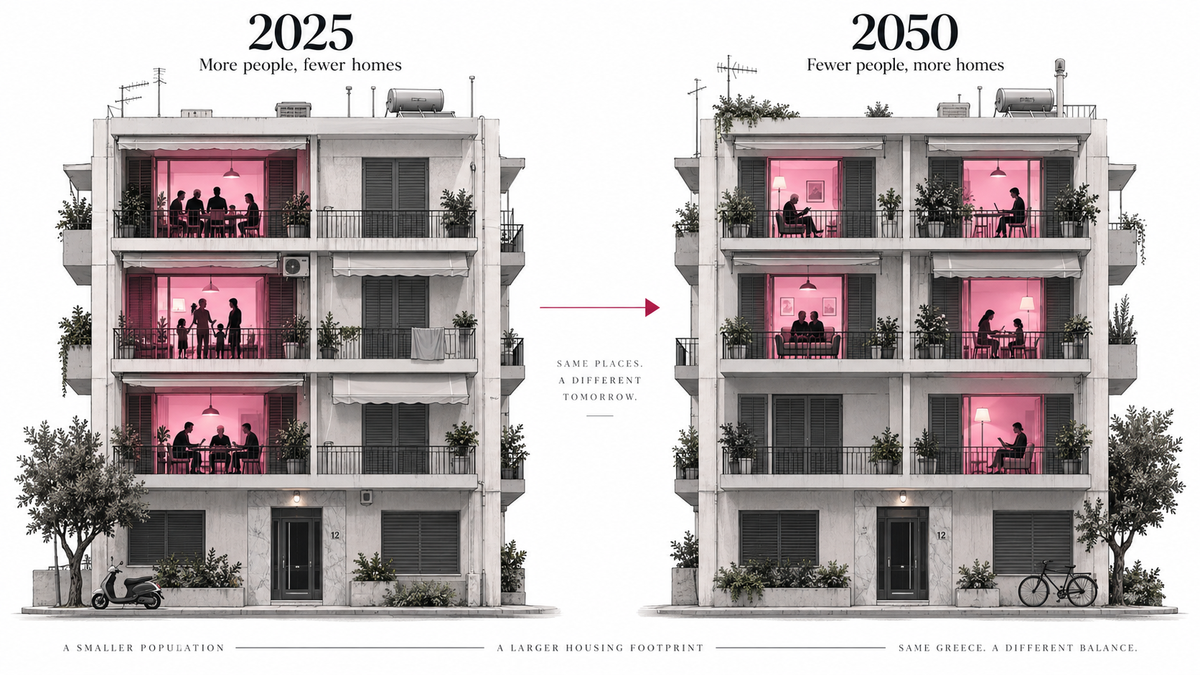
Fewer people can reduce demand for an unchanged housing stock
Greece's population decline can leave fewer households needing homes while the homes remain available. With average household size unchanged, Eurostat's projected population decline from 10.37 million in 2025 to 9.18 million in 2050 would mean 11.5% fewer resident households. If the stock of usable homes also stayed unchanged, there would be 11.5% fewer households per available home. That would ease housing pressure relative to 2025. Eurostat national projections; scenario calculation
Smaller households can absorb some or all of that reduction. If average household size falls by 0.25% each year, the same population projection leaves 5.8% fewer households by 2050. At 0.50%, households instead rise by 0.3%; at 0.75%, they rise by 6.9%. With available homes unchanged, those last two scenarios put more households against the same supply, despite the smaller population. Household-size scenarios
The demand side of this comparison is the number of resident households needing accommodation. The supply side is homes that are usable and available to residents. Buildings may remain standing while individual homes deteriorate or pass into other uses. Comparing the two sides shows whether resident housing pressure falls or rises; it does not measure today's shortage or establish that falling pressure produces a surplus.
If available homes stay unchanged, does housing demand fall?
Greece, household change between 2025 and 2050. Available homes: 0% change.
Demand here means resident households. The zero line represents unchanged available homes; it does not establish an initial balance or a housing surplus. The private-household population share is held constant.
Source: Eurostat EUROPOP2025, national baseline (proj_25np). Calculations: Econscope by The Agora Review.View the figure’s data
| Annual household-size reduction | Size change by 2050 | Household change by 2050 | Available homes change |
|---|---|---|---|
| 0.00% | 0.0% | −11.5% | 0.0% |
| 0.25% | −6.1% | −5.8% | 0.0% |
| 0.50% | −11.8% | +0.3% | 0.0% |
| 0.75% | −17.2% | +6.9% | 0.0% |
The analysis follows that relationship from the national outlook to the wider areas containing Athens, Thessaloniki, Patras, Heraklion and Larissa. It combines the census record with Eurostat's population projections and explicit household-size and supply assumptions. The methods, source notes and data reconciliation accompany a downloadable scenario workbook.
The census record explains why household size matters. Population fell from 10.82 million to 10.48 million between 2011 and 2021, while private households rose from 4.13 million to 4.33 million. That is a population decline of 3.1% alongside household growth of 4.8%: almost 334,000 fewer residents, but almost 198,000 more households. Using residents living in private households, rather than the entire population, average household size fell from approximately 2.555 people to 2.371. The reduction in people living together more than offset the population decline. ELSTAT national census results; private-household members
Fewer residents, more households
Population and private-household change between the 2011 and 2021 censuses.
View the figure’s data
| Geography | Residents | Households |
|---|---|---|
| Greece | −3.1% | +4.8% |
| Athens municipality | −3.1% | +8.3% |
| Thessaloniki municipality | −1.9% | +6.9% |
| Patras municipality | +0.9% | +13.6% |
| Heraklion municipality | +3.1% | +7.5% |
| Larissa municipality | +0.9% | +7.9% |
Every municipality in the five-city comparison gained households. Athens added 8.3% and Thessaloniki 6.9%, despite both losing population. Patras recorded household growth of 13.6%, Heraklion 7.5% and Larissa 7.9%. Those municipalities also gained residents, but their household counts grew considerably faster. The result spans places with different population trajectories: the number of people alone understated the change in separate households in all five. ELSTAT 2011 household tables; 2021 household tables
These totals cannot establish how much of the subsequent rise in prices came from household formation. The census records living arrangements, including arrangements people may have accepted because housing was expensive or unavailable. An adult who would prefer to move out but remains with family does not appear as an additional household. The observed increase nevertheless establishes something consequential: Greece's previous decade of population decline did not produce a parallel decline in the number of resident households.
A smaller household can still need a whole home
A household's accommodation requirement does not shrink in neat proportion to its membership. A couple whose children leave may continue living in the same apartment. After one partner dies, the surviving partner may remain there alone. In each case the household contains fewer people while continuing to occupy a home. If the departing children establish separate homes, the household count can rise even as the original household becomes smaller. These are different processes with the same arithmetic effect on the relationship between people and households.
A simple illustration gives the change a scale. One hundred people living in households of 2.5 people form 40 households. Ninety people living in households of two form 45. Population has fallen by a tenth, but the number of households has risen by an eighth. The example says nothing about the particular dwellings those households occupy or their ability to pay. It demonstrates why a count of residents can move in the opposite direction from the number of homes needed to accommodate separate households.
Across Greece, the census change in average household size corresponds to an annual reduction of approximately 0.747% between 2011 and 2021. Carrying that rate forward would be an assumption about future behaviour and living arrangements. The analysis therefore tests a range: no further decline in household size, then annual reductions of 0.25%, 0.50% and 0.75%. The last is close to the historical national pace. The first three allow that pace to slow substantially or stop. ELSTAT census results; household-size calculation
The range has an economic meaning as well as a demographic one. Smaller households can reflect ageing, relationship changes or a greater ability to establish an independent home. Larger or slower-shrinking households can reflect different preferences, family arrangements or constrained access to housing. The census aggregate does not separate those contributions. A slowdown in household formation could reduce measured pressure while leaving some people's wish for independent housing unmet. That possibility matters when interpreting a lower household count as an improvement in living conditions.
The calculation holds constant the share of the population living in private households. It then divides the population path by the assumed path of average household size, expressing the result as an index with 2025 equal to 100. This permits comparisons without pretending that the 2021 census supplies an observed household count for 2025. It also keeps the exercise focused on one question: given the population projection, how much difference does household size make? Definitions and calculation
Ageing also changes the kinds of homes that may be useful. A household becoming smaller does not guarantee that its dwelling is readily transferred to a new family, nor that another household can use an empty home in a different town. Dwelling size, accessibility, condition and location matter alongside the count. The national arithmetic is a first step towards understanding accommodation needs. The geography and usability of the stock determine how much of that arithmetic reaches a particular market.
How much household formation offsets depopulation
Eurostat's EUROPOP2025 baseline incorporates assumptions about fertility, mortality and migration. The national results were published in April 2026, with regional results following in June. Eurostat explicitly describes these as conditional projections. They show the population that would follow if the assumptions held, giving a consistent basis for examining housing scenarios while leaving room for a different demographic future. Eurostat release; regional projection metadata
The opening chart holds that population path constant. Its four outcomes differ because a gradual annual change in household size accumulates over 25 years. At the highest tested rate, a 0.75% reduction each year makes average household size about 17.2% smaller by 2050. That cumulative reduction is larger than the projected population decline, leaving more separate households to accommodate. The rate applies to the previous year's average size each year, so its effect compounds. Compounding and scenario calculations
Population decline remains a downward influence on resident housing demand even when the final number of households rises. For any fixed household-size path, a smaller population produces fewer households than an unchanged population would. The chart then compares the household count under each scenario with its own 2025 starting point. Depopulation can therefore restrain demand while smaller households still leave an unchanged housing stock accommodating more separate households. The direction of the population effect and the net change in households are both relevant to the housing outlook.
The break-even rate is approximately 0.49% a year. At that pace, the cumulative reduction in average household size almost exactly offsets the projected population decline between 2025 and 2050. It is a useful measure because it places the argument on a scale: a change of a few tenths of a percentage point in an annual assumption accumulates into a materially different housing outlook over 25 years. It is an endpoint calculation, not a prediction that household numbers remain perfectly flat throughout the period. Break-even calculation
The explorer starts with household size and available supply both unchanged, making the population effect visible on its own. The 0.25% household-size path then represents an illustrative slowdown from the historical pace. The 0.50% path shows how almost all the demographic easing disappears under a faster move towards smaller households. The 0.75% path asks what would happen if the historical national pace broadly continued. None is assigned a probability; together they expose the assumptions behind very different answers to the same housing question.
Migration adds another source of variation. Eurostat's national lower- and higher-migration variants place Greece's population in 2050 at approximately 8.73 million and 9.63 million respectively, compared with 9.18 million in the baseline. That range is large enough to affect the number of households materially even before considering where additional residents settle. The main figures retain the baseline so that changes in household size remain easy to see; the alternative population paths show why those figures cannot be assigned the certainty of a forecast. Eurostat national projection variants
A national population total consequently needs a household-size assumption before it can describe the resident accommodation requirement. It also needs a location. The same countrywide reduction can have different consequences if households remain dispersed or become more concentrated around particular cities. A home released in one place contributes to the national stock without necessarily meeting the need of a household elsewhere.
The horizon matters too. A lower household count in 2050 can coexist with little reduction over the next several years. For someone seeking housing now, the path between the starting point and the endpoint is consequential. The explorer at the end follows that path at five-year observations. The regional comparison adds the question of where the projected population decline offers more or less room for easing.
Five cities face different demographic surroundings
The census history above concerns municipalities. The forward comparison uses the wider geographies available in Eurostat's regional projections: Attica for Athens, the Thessaloniki regional unit, Achaia for Patras, Irakleio for Heraklion and Larisa for Larissa. Attica includes the Athens sectors, suburban territory, Piraeus and Islands. It is a reproducible geographic proxy, encompassing several housing markets. The other regional units likewise extend beyond their named cities. Eurostat regional projections; geographic definitions
This distinction changes the interpretation. Between 2011 and 2021, the population of Larisa regional unit fell by 5.4%, while Larissa municipality grew by 0.9%. Patras and Heraklion also gained residents within regional units whose populations declined. A future reduction across a region could therefore coexist with continued concentration in its main city. Homes released elsewhere in that region would not necessarily be substitutes for homes near the city's jobs, services and family networks. The comparisons below apply the same household-size assumptions everywhere to isolate the different population paths; they do not assume that household behaviour will actually evolve identically. ELSTAT municipal population; regional population
Household formation changes the regional picture
Estimated household change, 2025–2050, under two annual household-size assumptions.
The national benchmark is −5.8% at 0.25% and +0.3% at 0.50%. Each region is assigned the same household-size assumptions for comparison.
Source: Eurostat EUROPOP2025, regional baseline (proj_25rp5). Calculations: Econscope by The Agora Review.View the figure’s data
| Projection geography | Size unchanged | 0.25% / year | 0.50% / year | 0.75% / year |
|---|---|---|---|---|
| Greece | −11.5% | −5.8% | +0.3% | +6.9% |
| Attica | −10.5% | −4.7% | +1.5% | +8.1% |
| Thessaloniki regional unit | −8.9% | −3.0% | +3.2% | +9.9% |
| Achaia | −11.7% | −6.1% | 0.0% | +6.5% |
| Irakleio regional unit | −3.9% | +2.4% | +9.0% | +16.1% |
| Larisa regional unit | −13.8% | −8.2% | −2.3% | +4.1% |
Athens: household formation absorbs much of Attica's decline
Attica's projected population falls by 10.5% between 2025 and 2050. With average household size falling by 0.25% annually, the household decline is 4.7%. At 0.50%, households increase by 1.5%. That leaves a relatively narrow demographic margin for easing across this large and varied region. The municipal history offers a reason to take household formation seriously: Athens had 320,645 households in 2021, compared with 296,096 in 2011, despite losing residents. Eurostat regional baseline; ELSTAT household tables; scenario calculations
Athens's census history is particularly useful because population decline and household growth occurred together within the municipality itself. The divergence cannot be explained simply by comparing a growing city with a shrinking rural hinterland. Changes in the number of people living together mattered within the city. Attica's future population decline therefore leaves a substantial unanswered question about the household formation taking place inside its constituent markets.
Thessaloniki: a modest reduction under slower household formation
The Thessaloniki regional unit loses 8.9% of its population in the baseline. Its household count falls by 3.0% under the 0.25% assumption and rises by 3.2% under the 0.50% assumption. Both outcomes leave much of the existing accommodation requirement intact. Within the municipality, households already grew from 147,400 to 157,507 between the last two censuses as population declined. Eurostat regional baseline; ELSTAT household tables; scenario calculations
The two middle assumptions place Thessaloniki on either side of an approximately stable household count. Continued household formation does not have to match the full historical national pace to absorb the regional population decline. Even the 0.50% assumption is sufficient. That sensitivity makes the condition and availability of existing homes especially relevant: the region could still be accommodating much the same number of households with fewer residents.
Patras: regional easing alongside a strong municipal household increase
Achaia's projected population falls by 11.7%. Households decline by 6.1% under the 0.25% assumption and remain approximately unchanged under the 0.50% assumption. The slower household-size path therefore produces more easing than in Attica or Thessaloniki. Patras municipality, however, recorded the largest historical household increase in this comparison: from 80,476 to 91,391, or 13.6%, between 2011 and 2021. Eurostat regional baseline; ELSTAT household tables; scenario calculations
Patras's population increased by just 0.9% over the census decade, far less than its household count. The city's household expansion therefore went well beyond the increase in residents. Achaia's projected decline could eventually reduce household demand, but reading it directly into a Patras housing plan would overlook the strongest observed household increase among these five municipalities. The local question is whether that formation slows, and how much, as the region loses population. ELSTAT municipal population
Heraklion: the weakest demographic route to relief
Irakleio regional unit has the smallest projected population decline among the five areas, at 3.9%. Even a 0.25% annual reduction in average household size is enough to reverse the household result into growth of 2.4%. At 0.50%, households grow by 9.0%; at 0.75%, by 16.1%. Of the four preset scenarios, only unchanged household size produces fewer households. Eurostat regional baseline; scenario calculations
Heraklion municipality's households rose from 68,118 to 73,197 between the censuses. The regional scenarios extend the supply question: under either middle household-size assumption, usable homes would have to increase simply to keep households per home at the starting ratio. That does not determine how many new buildings are required, because existing properties can return to use. It does mean that relying on the population decline alone leaves the modelled growth in households unaddressed. ELSTAT household tables; scenario definitions
Larissa: the strongest regional decline, with a clear concentration risk
Larisa regional unit has the largest projected population decline, at 13.8%. Households fall by 8.2% under the 0.25% assumption and by 2.3% under the 0.50% assumption. At 0.75%, even this region records household growth of 4.1%. Its demographic starting point creates more potential easing than elsewhere in the comparison, but the household-size assumption continues to determine the sign of the result. Eurostat regional baseline; scenario calculations
Larissa municipality's households rose from 59,026 to 63,695 while the surrounding regional unit lost residents. Here the evidence most clearly raises a distribution problem. If households become more concentrated in the city, homes released by regional decline could be poorly located for those households. Larisa's stronger demographic easing makes avoiding unnecessary additions to stock more relevant, but deciding where to restrain building and where to improve supply requires a view inside the regional total. ELSTAT household tables; regional census record
The homes available can change the result
So far, the comparison has followed the number of households. Its housing significance depends on the stock available to accommodate them. A country can lose residents and also lose usable homes through deterioration, demolition or a shift into other uses. It can gain usable homes through construction, renovation, conversion or the return of previously unavailable properties. The balance of those additions and losses can reinforce or absorb demographic easing.
Pressure eases when usable supply grows faster than households, or when households fall faster than supply. It increases when households grow faster than usable supply, or when homes are withdrawn faster than households disappear. The calculation records this relationship as households per usable home, indexed to 100 in 2025. That starting value permits a comparison of changes; it does not assume that the market began in balance. Supply and pressure-index definitions
This distinction is particularly relevant to Greece's empty-home debate. The IMF's 2026 assessment reports that around 35% of dwellings are not primary residences, while approximately 12–13% of the total stock is vacant after excluding holiday and secondary homes. Those categories represent different opportunities for resident housing. The assessment also discusses condition, energy inefficiency and ownership complications that can prevent apparently available stock from returning to use. A dwelling can exist in the statistics while requiring substantial work or agreement before a household can move in. IMF, Greece: Selected Issues, 2026
Ownership and use need equally careful treatment. A home purchased by an investor and rented to a resident remains part of resident housing supply. A change in ownership alone does not establish that supply has been withdrawn. Investor purchasing power can affect the price paid for the asset, while the property's subsequent use determines whether it accommodates a resident household. Separating those channels makes it possible to examine both housing availability and the competition to buy.
Usable supply can absorb or amplify demographic easing
Greece, change in households per usable home by 2050. Household size falls 0.25% annually.
The denominator includes homes available for resident use. An index of 100 in 2025 does not establish that the housing market was balanced.
Source: Eurostat EUROPOP2025 national baseline; Econscope supply assumptions. Calculations: Econscope by The Agora Review.View the figure’s data
| Annual usable-supply change | Pressure change by 2050 | First five-year observation at −5% |
|---|---|---|
| −0.25% | +0.3% | Not reached by 2050 |
| 0.00% | −5.8% | 2050 |
| +0.25% | −11.5% | 2040 |
| +0.50% | −16.8% | 2035 |
The national sensitivity calculation holds the annual household-size reduction at 0.25%. If usable supply is unchanged, households per usable home fall by 5.8% by 2050. If supply contracts by 0.25% each year, that easing disappears and the ratio rises by 0.3%. If supply instead expands by 0.25% annually, the ratio falls by 11.5%; at 0.50% supply growth, it falls by 16.8%. These are illustrative net supply paths. Their value is to show the scale of the denominator's influence over a long horizon. Supply sensitivity calculations
Independent research also finds that depopulation can coexist with further building requirements. The European Commission's 2026 country report cites an estimated construction gap of about 110,000 dwellings by 2035. That is a separate conditional modelling result which incorporates regional needs; it is not a direct count of homes missing today. Its aggregation counts shortage regions without offsetting them against surpluses elsewhere. A home in an oversupplied area cannot automatically meet a need in another location. European Commission, Greece Country Report 2026; JRC housing-needs framework
Less pressure reaches prices through a local market
Recent prices show how far Greece remains from a simple correspondence between population decline and cheaper housing. The Bank of Greece's provisional figures for the second quarter of 2026 show nominal apartment-price growth of 5.5% nationally, 5.0% in Athens and 4.7% in Thessaloniki compared with a year earlier. These are bank-valuation-based apartment indices. They establish the recent direction of measured values, without identifying the contribution made by population, household formation or any single policy. Bank of Greece, Q2 2026 apartment prices
Current asking-price context across the five cities
Indomio's September 2026 averages provide a separate view of advertised sale prices. Its areas differ from the projection regions, and changes can reflect the mix of properties listed. These figures are not completed-sale prices or quality-adjusted transaction indices.
| Indomio area | Asking price per m² | Annual change |
|---|---|---|
| Athens–Center | €2,844 | +5.88% |
| Thessaloniki municipality area | €2,696 | +3.53% |
| Patras | €1,758 | +7.99% |
| Heraklion, Crete | €2,351 | +9.65% |
| Larissa | €1,673 | +17.98% |
Prices emerge from the households and investors competing for the particular homes actually offered. Income, savings, family transfers and access to credit determine what buyers can bid. Mortgage costs affect the payments a given loan requires. Owners decide whether to sell or let, while buyers assess location, condition and expected future returns. A reduction in resident households can alter that competition, but the price response depends on these other conditions and on how readily supply adjusts.
Turning the household-and-supply comparison into a price projection would require evidence about how that relationship affects local rents and sale prices, alongside financing and purchasing power. Applying a one-for-one percentage change would invent a relationship the model has not estimated. Even where fewer households release homes, the properties can enter the market slowly or in places where demand was already weak.
Affordability introduces another comparison. A lower euro price is a nominal decline. A price that rises more slowly than general inflation falls in real terms. A home becomes more affordable relative to income when its cost takes a smaller share of a household's resources, although mortgage terms and running costs also matter. Those outcomes can occur on different schedules. An unchanged sale price can become easier for a buyer to carry if income rises sufficiently; a lower price can remain inaccessible when income or borrowing capacity falls.
This extends the distinction between the availability of homes and buyers' purchasing power developed in Western Prosperity, Reconsidered. Demography changes the number and distribution of resident households entering that market. Household size determines how much population decline reduces their number. Usable supply determines how many dwellings can accommodate them. The financial position of those competing for the available homes then shapes access and price.
For housing policy, these relationships favour decisions made at the scale of the actual market. Long-term population decline belongs in the appraisal of new construction, particularly where household demand may weaken. In places where households continue to concentrate, renovation, conversion and additional homes can still be necessary. An empty dwelling should be assessed for its location, condition and prospects of returning to use; a proposed new dwelling should be assessed against the households likely to need it.
A smaller population can therefore leave more housing available relative to residents' needs. With household size and usable homes unchanged, Greece's population decline produces 11.5% fewer households per home by 2050. Allowing household size to fall by 0.25% annually reduces that easing to 5.8%; at 0.50%, it disappears. Maintaining or expanding the usable stock determines whether the reduction in demand translates into fewer households per home; the homes' location determines which households can benefit. Scenario results
This gives depopulation a clear place in housing policy: it can reduce the number of households that the stock must accommodate, but it does not maintain that stock or move it to where people need to live. Assessing those local changes is necessary even in a shrinking country. The useful outcome is better access to suitable homes for resident households, whether that comes from fewer competing households, more homes becoming available, or both.
The explorer below returns to the same question for each area. It starts with household size and usable supply unchanged, showing what population decline alone would do. Change either assumption to see whether resident households increase or decrease relative to available homes. All comparisons are against 2025 and use the official baseline population path. The starting settings establish a comparison, rather than selecting a most likely future.
Methods and evidence
What the scenarios measure
The demand measure is resident households needing accommodation; the supply measure is usable homes available to residents. The calculations translate one official population projection into alternative paths for these two quantities. They show whether households per available home rise or fall relative to 2025. They do not estimate an absolute housing shortage, the number of dwellings that must be built, or a future sale price.
Population, household size and usable supply
Let Pt be population in year t, n the number of years since 2025, d the assumed annual proportional reduction in average household size, and g the assumed annual net growth of usable housing supply. The three indices start at 100 in 2025:
Household index = 100 × (Pt / P2025) / (1 − d)n
Usable-supply index = 100 × (1 + g)n
Households per usable home index = 100 × household index / usable-supply index
Rates are decimals in the calculation: a 0.25% annual reduction is d = 0.0025. A 0.50% annual supply increase is g = 0.005; a 0.25% supply contraction is g = −0.0025. Changes compound annually. A household-size rate is a proportional change in people per household, rather than a fixed number of people removed each year.
The share of the population living in private households is held constant. With that share unchanged, it cancels from the ratio. The model therefore does not need an invented 2025 household count. Usable supply means homes available for resident household use. Its net growth includes construction, renovation, reactivation and residential conversion, less demolition, deterioration and withdrawals into other uses.
The two starting indices of 100 describe each quantity relative to its own base. They do not mean that the absolute numbers of households and available homes were equal, or that every household had adequate housing. A gap between the indices records different proportional changes; the pressure result is calculated from their ratio, not that gap. Neither measure gives a count of surplus or missing homes. Household counts also leave dwelling size, condition, location, overcrowding and purchasing power unresolved.
Annual compounding and the minimum household size
If average household size starts at a2025, its conditional value after n years is a2025 × (1 − d)n. Each annual reduction applies to the previous year's average. At the highest tested rate, 0.75% a year, the 2050 value is (1 − 0.0075)25 ≈ 0.828443483 times the starting value. Average household size is therefore approximately 17.1557% smaller, with 82.8443% of its starting value remaining. The cumulative reduction is not 25 × 0.75%.
A nonempty private household has at least one person, so its average size cannot fall below one. To remain at or above that floor throughout the 25-year horizon at the highest tested rate, the starting average must satisfy a2025 ≥ (1 − 0.0075)−25 = 1.207082945964… people per household, approximately 1.2071. At lower rates the required starting average is lower.
No observed 2025 average household size for each area is used to anchor this model. The observed 2021 national average is a historical reference, not a substituted 2025 observation. The explorer therefore shows proportional paths and the starting-size condition above; it does not establish an absolute household-size forecast or silently clamp a hypothetical average to one. Extending a constant proportional decline indefinitely would eventually breach the one-person floor, which is a reason to keep the stated horizon explicit.
Observed history and projection geographies
The historical comparison uses ELSTAT's 2011 and 2021 census populations and private-household counts. Average household size uses people living in private households: 10,563,717 divided by 4,134,540 in 2011, and 10,270,093 divided by 4,332,447 in 2021. Their compound change implies an annual household-size reduction of approximately 0.747%. This is a historical reference, not a future household forecast. ELSTAT census results
Future population paths use the EUROPOP2025 baseline: national dataset proj_25np and regional dataset proj_25rp5, with both sexes and all ages combined. Values refer to 1 January. The 2025 base remains the base of that projection vintage, even if later population estimates are revised.
Athens is represented by the sum of Attica's NUTS 3 areas EL301–EL307, including the Athens sectors, East and West Attica, and Piraeus and Islands. The other proxies are Thessaloniki regional unit (EL522), Achaia around Patras (EL632), Irakleio around Heraklion (EL431), and Larisa around Larissa (EL612). None is relabelled as a municipal forecast. Regional data · Regional metadata
Using the same household-size rate across areas makes the sensitivity comparison consistent. It does not assume that the areas will actually share identical ageing, migration or household-formation patterns. The national lower- and higher-migration variants are discussed separately; they are not imposed on the five regional paths.
The 5% comparison line and the meaning of a date
The optional comparison line is an index of 95: 5% fewer resident households per usable home than in 2025. It is an illustrative benchmark, not an estimated price trigger or proof that a shortage has disappeared. With supply unchanged, reaching it means 5% fewer households; with supply changing, both sides of the ratio matter.
Scenario figures and the explorer use the common five-year grid: 2025, 2030, 2035, 2040, 2045 and 2050. A reported date is the first five-year observation meeting the benchmark. A connecting line guides the eye and does not establish an exact crossover year. “Not reached by 2050” describes the displayed observations within this horizon.
At the Greece starting settings, with household size and usable supply both unchanged, the first qualifying five-year observation is 2040. With household size falling 0.25% annually and supply unchanged, it is 2050. With household size falling 0.25% and usable supply growing 0.50% annually, it is 2035. These comparisons locate a conditional reduction in households per home, without estimating when a current shortage ends.
Benchmark comparisons use unrounded calculated indices and test whether the value is at or below 95. Display rounding does not determine whether the benchmark is met. Percentage changes are normally shown to one decimal place; a negative change that rounds to zero is displayed as 0.0%, without a minus sign.
The national projection is also available annually. An annual-series check puts the first qualifying year at 2037 when household size and usable supply are unchanged, and at 2048 when household size falls 0.25% annually and supply is unchanged. On the common five-year grid used in this article, those results appear as 2040 and 2050. This difference reflects sampling, not a different model.
The approximate 0.49% annual household-size reduction that offsets national depopulation by 2050 is calculated as 1 − (P2050 / P2025)1/25. It is an endpoint break-even rate, not a guarantee of an unchanged household count in every intervening year.
Prices, outside models and source limitations
Bank of Greece figures measure nominal apartment-price changes using bank valuations. The separate Indomio snapshot contains September 2026 asking-price averages in the provider's geographic areas. These are different measures and boundaries. Asking-price changes can also reflect changes in the properties advertised.
The Commission's estimate of a 110,000-dwelling construction gap by 2035 comes from a separate ECFIN–JRC framework that includes regional shortages, future demographic requirements, replacement needs and expected construction. It uses older demographic inputs and fixed age- and sex-specific census household-formation rates. It is neither a count of today's missing homes nor a validation of this article's household-to-supply calculations. Relevant passages of the JRC methodology were checked; that model was not independently replicated.
Small differences between detailed ELSTAT census tables and earlier national releases arise from statistical disclosure protection. They do not affect the displayed historical rates. Calculations retain the stated source values; percentages are rounded for presentation. The complete source register records dates, definitions and source-specific qualifications.
Full source register and evidence notes
Research documentation
Source register
Source inputs were checked against official statistical releases, original documents and the listing provider's own pages on , America/Chicago. Calculations of households, usable supply and households per usable home are Econscope scenarios. Source dates, reference periods and publication dates serve different purposes and are kept separate below.
The review verifies the material input figures and the relevant methodological passages. It does not claim to have independently replicated outside models. The Commission country report supplies the cited 110,000-dwelling construction-gap estimate; the JRC technical report explains its separate demographic, household and stock framework.
Observed population and households
S01 ELSTAT — 2021 Census results: Greece
- Population: 10,816,286 in 2011 and 10,482,487 in 2021.
- Private households: 4,134,540 in 2011 and 4,332,447 in 2021.
- One-person households: 1,061,547 in 2011 and 1,401,443 in 2021.
Definitions and qualifications
Census counts are observed historical data, not the EUROPOP2025 projection base.
Average private-household size must use private-household members, rather than total population.
S02 ELSTAT — 2011 Census, table B19: households and members by household size
- National households: 4,134,540; private-household members: 10,563,717.
- Municipal households: Athens 296,096; Thessaloniki 147,400; Patras 80,476; Heraklion 68,118; Larissa 59,026.
Definitions and qualifications
Legacy XLS file. The Greek-language landing page's generated /el/statistics resource link redirected incorrectly during retrieval; the equivalent /statistics resource address works.
Municipal geography differs from the wider regions used for projections.
S03 ELSTAT — 2021 Census, table B03: households and members by household size, municipalities
- Municipal households: Athens 320,645; Thessaloniki 157,507; Patras 91,391; Heraklion 73,197; Larissa 63,695.
Definitions and qualifications
The detailed B03 national totals differ by one household/member from A06. ELSTAT's confidentiality method explains small differences across releases; use S01/S04 for national totals.
Published cell values are subject to the Cell Key Method. Do not force small discrepancies to reconcile by altering source values.
S04 ELSTAT — 2021 Census, table A06: private households and their members
- National private households: 4,332,447; private-household members: 10,270,093.
- Together with S02, supports average household sizes of approximately 2.555 in 2011 and 2.371 in 2021 and a compound annual size reduction of approximately 0.747%.
Definitions and qualifications
The download filename contains 2011, but the internal Greek and English table titles explicitly identify the 2021 Population Census. The file is valid for 2021.
The historical compound rate is a descriptive calculation, not a prediction of future household formation.
S05 ELSTAT — Census 2021 GIS, municipalities
- Athens population: 664,046 to 643,452.
- Thessaloniki: 325,182 to 319,045; Patras: 213,984 to 215,922.
- Heraklion: 173,993 to 179,302; Larissa: 162,591 to 164,095.
Definitions and qualifications
These are municipality boundaries, not metropolitan housing-market definitions.
S06 ELSTAT — Census 2021 GIS, regional units
- Larisa regional-unit population: 284,325 to 268,963, a decline of approximately 5.4%.
- Achaia: 309,694 to 305,979; Iraklio: 305,490 to 305,017.
- These regional units lost population while their named municipalities gained residents.
Definitions and qualifications
Historical urban concentration does not establish the future pace or direction of within-region migration.
S22 ELSTAT — Confidentiality methodology for the 2021 Population–Housing Census
- ELSTAT applies the Cell Key Method, adding small amounts of noise to selected cells to protect confidentiality.
- Published totals may not equal the sum of component cells, and small differences can occur across previously released results.
Definitions and qualifications
Disclosure perturbation is distinct from percentage display rounding.
It does not justify changing published observations to make them add up.
Official population projections
S07 Eurostat — EUROPOP2025 national population projections (proj_25np)
- Greece baseline: 10,372,335 in 2025; 9,934,432 in 2035; 9,182,676 in 2050.
- 2050 national migration sensitivity variants: 8,733,629 under lower migration and 9,634,416 under higher migration.
- National observations are available annually.
Definitions and qualifications
Use sex=T, age=TOTAL, unit=PER, geo=EL and projection=BSL for the baseline.
The same 2025-based projection vintage is retained throughout; do not replace its base with a later population estimate.
Migration variants are national sensitivities. The article does not apply national variant ratios to the regional proxies.
Publication date is the national news release; the queried dataset reports a later data update of 11 June 2026.
Reproducible API query for the cited years and national variants
S08 Eurostat — EUROPOP2025 regional population projections (proj_25rp5)
- Attica aggregation, EL301–EL307: 3,764,272 in 2025; 3,624,638 in 2035; 3,370,141 in 2050.
- Thessaloniki EL522: 1,081,843; 1,051,309; 985,258.
- Achaia EL632: 299,688; 286,484; 264,477.
- Irakleio EL431: 301,599; 298,257; 289,974.
- Larisa EL612: 266,074; 251,510; 229,370.
Definitions and qualifications
These regional proxies are not municipal or exact metropolitan forecasts.
Attica includes the four Athens sectors, East Attica, West Attica, and Piraeus and Islands.
Use baseline BSL, total sex and age, person units, and the same five-year observation grid.
The release month is documented; no exact June publication day is asserted.
S09 Eurostat — EU population projections release
- National population projections were published on 16 April 2026.
- Eurostat describes population projections as conditional scenarios based on assumptions about fertility, mortality and migration.
Definitions and qualifications
The article's Greece figures are taken from S07, not inferred from EU-wide headline figures in this release.
S10 Eurostat — EUROPOP2025 regional metadata
- Baseline regional projections were disseminated in June 2026.
- Regional data use NUTS 2024; projection results are conditional on demographic assumptions.
Definitions and qualifications
Population-projection metadata do not supply official household or house-price projections.
Future within-region urban concentration is not resolved by a NUTS 3 aggregate.
Housing supply, prices and related analysis
S11 IMF — Greece: Selected Issues, Country Report No. 26/109
- Pages 4 and 11 distinguish roughly 35% of dwellings not used as primary residences from 12–13% of total stock that is vacant; holiday and secondary homes account for the rest.
- The housing chapter discusses smaller households, concentrated demand, dwelling condition, fragmented ownership and barriers to effective supply.
Definitions and qualifications
Vacancy does not establish immediate habitability or availability to resident households.
The IMF's analysis is contextual evidence; it does not validate the Econscope scenario thresholds or provide a city price-fall date.
S12 European Commission — 2026 Country Report: Greece
- Page 111 cites an estimated housing construction gap of 110,000 dwellings by 2035.
- Footnote 321 identifies Balouktsi et al. (2026), Housing investment needs in the EU, JRC144419.
Definitions and qualifications
The construction gap is a conditional modelling estimate, not a direct count of today's missing homes.
It comes from a different model and horizon from the Econscope scenarios.
The supplied EUR-Lex PDF address redirected incorrectly during verification; this is the Commission's working download address.
S13 Joint Research Centre — Housing investment needs in the EU
- The report uses a bottom-up NUTS 3 demand and supply framework to estimate housing requirements through 2035.
- Sections 3 and 5.2 explain why oversupplied regions do not offset shortages in other regions.
- The demographic inputs use 2019-based regional projections, partly adjusted using 2023-based national projections. Household formation is derived from fixed age- and sex-specific census headship rates.
Definitions and qualifications
Its projection vintage, household method and stock model differ from this article's EUROPOP2025 household-size sensitivities.
The report does not estimate the housing needed to achieve a specified affordability target.
Relevant scope, demographic-input, household-method, aggregation and limitations sections were reviewed. The JRC model was not independently replicated.
The Greek construction-gap figure is attributed to the Commission country report, S12.
S14 European Commission — Housing affordability analysis, Box 6.1 on investment needs
- Box 6.1 describes accumulated construction shortfalls, projected demographic needs, replacement needs and expected construction.
- Shortage regions contribute to the aggregate; oversupplied regions are set to zero.
- The framework accounts for the distinction between the total dwelling stock and dwellings occupied as primary residences.
Definitions and qualifications
This related Commission working document provides additional context for the ECFIN–JRC framework; the later technical report is directly accessible as S13.
Its stock, demographic and construction assumptions differ from the transparent Econscope sensitivity model.
S15 Bank of Greece — Indices of residential property prices: Q2 2026
- Provisional nominal apartment-price growth: Greece 5.5%; Athens 5.0%; Thessaloniki 4.7%.
- The indices draw on credit institutions' valuations and reported property characteristics.
Definitions and qualifications
These are nominal apartment-price indices, not asking-price averages or a direct measure of affordability.
These geographies and methods do not match the Indomio snapshot or projection proxies exactly.
S21 Econscope — Western Prosperity, Reconsidered
- Editorial context: housing availability affects market tightness while wealth, savings, family support and credit affect buyers' bidding power.
Definitions and qualifications
Used to connect the argument, not as the underlying source for new statistical claims.
Historical policy details in the earlier article were not imported as current facts.
September 2026 asking-price snapshot
S16 Indomio — Athens–Center residential asking prices
- Mean asking sale price €2,844/m²; annual change +5.88%.
Definitions and qualifications
Provider-defined Athens–Center area, not all Attica.
Asking prices are not completed transactions or quality-adjusted indices; the mix of advertised properties can change.
Live page may later display a newer month.
S17 Indomio — Thessaloniki municipality-area residential asking prices
- Mean asking sale price €2,696/m²; annual change +3.53%.
Definitions and qualifications
Provider-defined municipality area, not the wider Thessaloniki regional unit.
Asking prices are not completed transactions or quality-adjusted indices; the mix of advertised properties can change.
Live page may later display a newer month.
S18 Indomio — Patras residential asking prices
- Mean asking sale price €1,758/m²; annual change +7.99%.
Definitions and qualifications
Provider-defined Patras area, not Achaia regional unit.
Asking prices are not completed transactions or quality-adjusted indices; the mix of advertised properties can change.
Live page may later display a newer month.
S19 Indomio — Heraklion, Crete residential asking prices
- Mean asking sale price €2,351/m²; annual change +9.65%.
Definitions and qualifications
This is Heraklion in Crete, not Irakleio municipality in Attica.
Provider area differs from Irakleio regional unit.
Asking prices are not completed transactions or quality-adjusted indices; live page may later display a newer month.
S20 Indomio — Larissa residential asking prices
- Mean asking sale price €1,673/m²; annual change +17.98%.
Definitions and qualifications
Provider-defined Larissa area, not the regional unit.
Asking prices are not completed transactions or quality-adjusted indices; the mix of advertised properties can change.
Live page may later display a newer month.
Original supplied inputs
The original Greece_Housing_Demographic_Scenarios.xlsx workbook supplied the scenario structure, historical comparisons, regional projection series and source references. The accompanying figure supplied the national household-size comparison. Both were treated as material to check and develop, rather than as independent authority for the underlying statistics.
The completed package preserves the input workbook as supplied. The publication's frozen dataset also includes separately verified national migration sensitivities and the Athens–Center and Thessaloniki Indomio observations, which were present in the supplied prose but absent from the workbook's source data.
How the publication relates to the original workbook
Input and publication reconciliation
How the published analysis relates to the supplied files
The article develops the supplied workbook, written analysis and national chart into one English publication. The core calculation remains the same. The evidence is presented with clearer distinctions between observed municipal history, official regional population projections and conditional household and supply scenarios.
What carries through
The EUROPOP2025 baseline and the five regional proxies are retained. The national population path and all quoted 2025, 2035 and 2050 regional values match the official datasets. Attica remains an aggregation of EL301–EL307. Thessaloniki, Achaia, Irakleio and Larisa remain EL522, EL632, EL431 and EL612 respectively.
The four published annual household-size reductions remain 0%, 0.25%, 0.50% and 0.75%. The usable-supply sensitivity retains −0.25%, 0%, +0.25% and +0.50% annual net change. The explorer starts with Greece, unchanged household size and unchanged usable supply. None is presented as an official central household forecast.
The original workbook is preserved as an input, rather than silently rewritten. Publication figures and the explorer share a frozen dataset and the same calculation module. Scenario results are derived from the supplied population paths and explicit assumptions; no absolute usable housing stock is invented.
Additional data verified for the article
The supplied prose included national migration sensitivities that were not stored in the workbook. Eurostat's API confirms Greece's 2050 population at 8,733,629 under the lower-migration variant and 9,634,416 under the higher-migration variant. The baseline is 9,182,676. These national alternatives are not assigned to the regional proxies.
The prose also included two asking-price observations absent from the workbook: Athens–Center at €2,844/m², up 5.88% annually, and Thessaloniki's provider-defined municipality area at €2,696/m², up 3.53%. Both refer to September 2026 and were verified directly on Indomio. The three other city observations were also checked. This snapshot remains separate from Bank of Greece indices and from the projection geographies.
Source clarifications
The ELSTAT A06 workbook used for national 2021 private-household members has “2011” in its download filename. Its internal table title explicitly identifies the 2021 Census, and its national values are 4,332,447 households and 10,270,093 household members. It is a valid 2021 source.
The more detailed 2021 B03 release gives national totals differing by one household or member from A06. ELSTAT's Cell Key Method introduces small perturbations for confidentiality and can make table components non-additive. The publication uses the stated national source consistently. These differences do not change any displayed historical percentage or substantive conclusion.
Some ELSTAT table links generated under /el/statistics redirected incorrectly during verification; their equivalent /statistics download resources worked. The Commission's supplied EUR-Lex PDF address also redirected incorrectly, so the source register provides the Commission's working ECFIN download. Required query parameters are retained; tracking parameters are removed.
Two source registers, with distinct identifiers
The sourceIds in data.json refer to the original workbook's register, S1–S18. The publication's sources.json and source page use a separate register, S01–S22. A matching number does not imply a matching source. The mapping below connects the original inputs to the evidence used in this publication.
| Workbook ID | Publication ID | Relationship |
|---|---|---|
| S1 | S07 | Eurostat national population projections. |
| S2 | S08 | Eurostat regional population projections. |
| S3 | S10; also S09 | Regional methodology; a separate national news release confirms the April release date. |
| S4 | S01 | National census results. |
| S5 | S04 | 2021 A06 national private-household members. |
| S6 | S02 | The 2011 national household-member count is independently confirmed in B19, rather than relying on the workbook's SAM03 landing page. |
| S7 | S15 | Bank of Greece Q2 2026 release, with its working full URL. |
| S8 | S18 | Indomio Patras. |
| S9 | S19 | Indomio Heraklion. |
| S10 | S20 | Indomio Larissa. |
| S11 | S11 | IMF Selected Issues. The same number here is coincidental. |
| S12 | Not used | The OECD item remains in the preserved workbook register. It is not relied on or represented as re-reviewed in this article. |
| S13 | S12 | Commission 2026 Greece report, via its working ECFIN download. |
| S14 | S13 | JRC144419 technical paper. |
| S15 | S21 | Econscope's related Western Prosperity essay. |
| S16 | S03 | 2021 B03 household table, reached through the supplied publication page. |
| S17 | S02 | 2011 B19 household table, reached through the supplied publication page. |
| S18 | S05; S06 | Municipal GIS and the related regional-unit layer. |
Publication sources S16 and S17 add the Athens–Center and Thessaloniki asking-price observations from the supplied prose. S14 supplies related Commission methodology context; S22 records ELSTAT's confidentiality method. National migration variants use S07.
Timing and the comparison benchmark
The fixed comparison is a 5% reduction in resident households per usable home from its 2025 index. It measures a relative change, without estimating today's shortage or translating that change into prices. It remains secondary to the continuous scenario paths.
The publication uses common five-year observations to compare all areas. With usable supply unchanged, Greece first meets the benchmark at the 2040 observation if household size is unchanged, and at the 2050 observation if household size falls 0.25% annually. The finer national annual series first meets those conditions in 2037 and 2048. The differing dates reflect observation frequency. They are not estimates of when prices fall.
Dates and extent of verification
The source review took place on 6 October 2026 in America/Chicago, corresponding to 7 October UTC during the overnight UTC interval. The supplied chart's “7 Oct 2026” label is not evidence of an additional data release or an instruction to future-date publication. The final article and export metadata use the actual production date. The reference periods of census, projection and market data remain explicit.
The external checks covered the relevant census tables, Eurostat API values and metadata, Bank of Greece release, all five Indomio pages, the IMF housing passages and the Commission's cited construction-gap figure. The direct JRC technical PDF was also retrieved and its relevant scope, demographic-input, household-method, aggregation and limitations sections reviewed. It uses EUROPOP2019 regional projections partly adjusted by 2023 national projections, fixed census headship rates and a regional housing-stock model. These differ from this article's EUROPOP2025 sensitivities. The JRC model was not independently replicated. The 110,000-dwelling estimate remains attributed to the Commission's report.
The Greek edition was produced after approval of the English article. Both editions retain the same data, scenarios and limits of interpretation. Translation does not constitute a new external-source check or an update of the market observations.